Statistics are an essential part of many types of PhD research, but they can be extremely difficult for non-specialists.
This is by no means a comprehensive guide, but I will try to give some basic working principles to help reduce avoid the most common mistakes.
Before doing statistical analysis, wherever possible create a visual representation of your data.
This will give you a much better intuitive understanding of what is going on. For example, if you have survey data using a Likert scale, where answers to questions are given as;
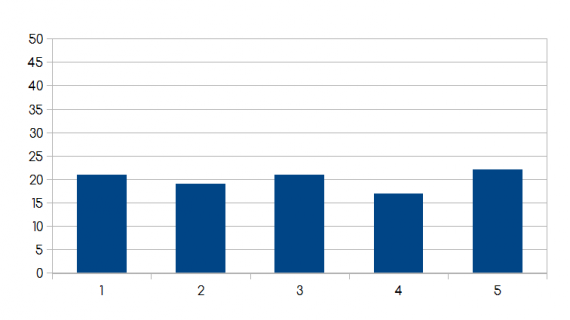
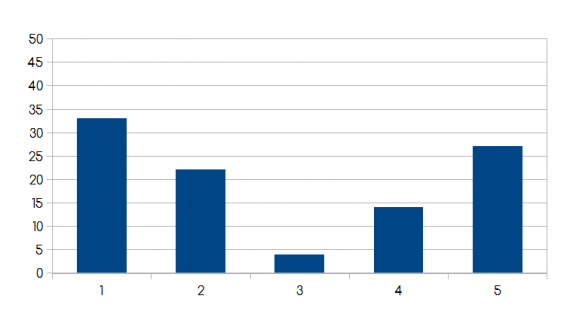
You may want to see how the answers to a specific question are distributed across all respondents. You can do this by plotting a histogram showing the number of responses at each point in the scale. Here are three examples of possible distributions:
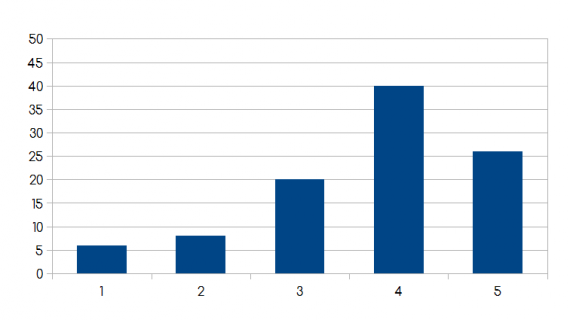
Without doing any statistics, you can instantly see how the data is distributed, and you can use this as a basis for your analysis
If you take the means of each of the three distributions above, you will get values of 3.7, 3 and 2.8.
But what do these values mean? In the first histogram, 3.7 clearly correlates to the peak at 4. In the second, the distribution is flat, so the mean just represents the middle of the range, and in the third, the mean is the least selected option. It’s up to you to then interpret what the mean means, but you can only do that when you can see the distribution of the data.
The standard deviation is a measure of the spread of data around the mean. It is widely used, but you need to be careful. If you use the standard deviation without plotting your data, then you can end up with a meaningless number.
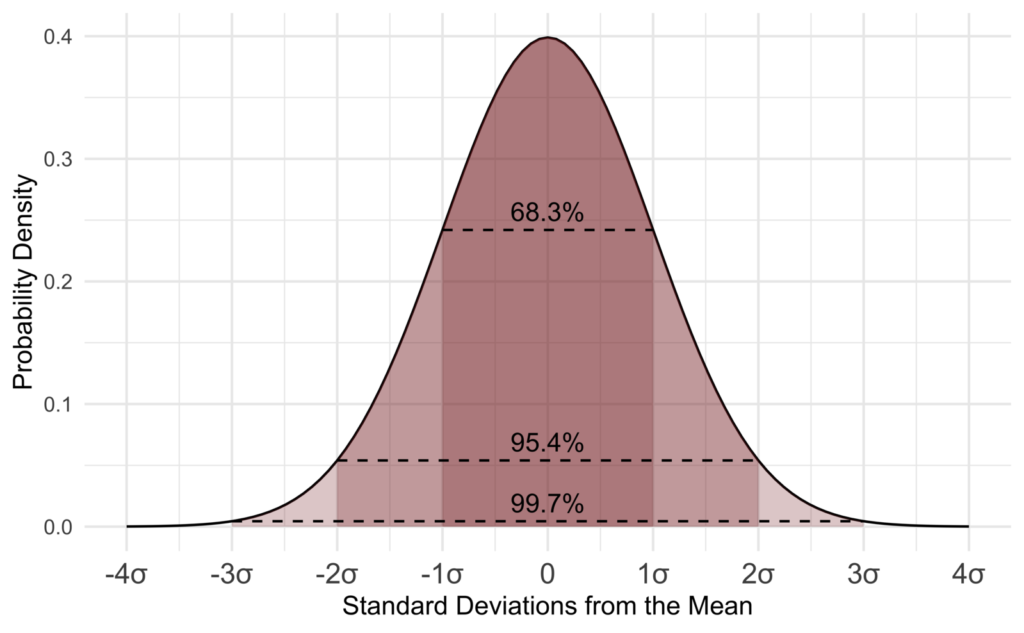
Standard deviation is best used when you have something approximating a normal distribution of data (the classic “bell curve” below)
When you say the standard deviation = x, this indicates that about 68% of the data lies within ± x of the mean.
But what if you have a graph with 2 peaks? Then the standard deviation becomes meaningless, even though a statistical program will still give you an answer.
When you use statistical analysis software, it will spit out countless different results, some will be useful, some not.
Don’t include numbers you don’t understand. Imagine an examiner asking, “what do these numbers mean?” and if you can’t answer, either find out or don’t include them.
Another potential hazard is that stats software will often give you numbers to many decimal places.
For example, let’s say you measure the height of every adult human being on earth and look for the mean. With several billion data points, your calculation of the mean might look something like 1.68234597864422 m (I just made this number up as an example). If you copy and paste this number, you are effectively claiming that you can measure the height of a human being to an accuracy of 0.00000000000002 m, which is much smaller than the radius of an atom.
Much better to give the value as 1.68 or 1.682, since this reflects the accuracy with which you can make a single measurement.
The same is true when giving an estimate of the error on a measurement. Giving an error of ± 2.336598774654654 is ridiculous. You can’t be that precise in an error estimate Stick to one (or two at the most) significant figures.
If you have 1 month left to submit your thesis and you are doing analysis for the first time, it’s going to be difficult.
So do some analysis early, on a small scale, so you have some experience before you do the full analysis. You will be able to take your time, while the pressure is still low. Most mistakes happen when doing things in a rush at the last minute, especially if you have never done that type of analysis before.
If you know what methods you are going to use, do a small trial run and analyse the data you get. Not only will this help you refine your methods and skills, but it will make the final analysis infinitely easier.
I’m not an expert in statistics, and can’t answer questions on specific analytical techniques or software, but am happy to answer questions on these basics. If any statisticians want to contribute (or point out any mistakes I’ve made), you’re more than welcome!
I offer one to one coaching in academic writing and general PhD survival skills. Click below to learn more and book your introductory session.

PhD: an uncommon guide to research, writing & PhD life is your essential guide to the basic principles every PhD student needs to know.
Applicable to virtually any field of study, it covers everything from finding a research topic, getting to grips with the literature, planning and executing research and coping with the inevitable problems that arise, through to writing, submitting and successfully defending your thesis.

All the text on this site (and every word of every video script) is written by me, personally, because I enjoy writing. I enjoy the challenges of thinking deeply and finding the right words to express my ideas. I do not advocate for the use of AI in academic research and writing, except for very limited use cases.
See also: